That gap between nameplate specs and real-world performance is exactly where efficiency measurement pays off. Without accurate baseline data on Free Air Delivery (FAD), specific power, and leakage, any efficiency improvement effort is guesswork.
This guide covers the instruments you need, the measurement methods that actually work, how to interpret results against ISO 1217 benchmarks, and the mistakes that produce misleading numbers.
Key Takeaways
- The five metrics that matter most: free air delivery (FAD), specific power (kW/100 CFM), discharge pressure, flow rate, and leakage rate
- Measure at the compressor discharge outlet — not the intake — per ISO 1217 requirements
- Calculate efficiency as input power (kW) ÷ air output (FAD) and compare to manufacturer CAGI data
- Each 2 psi increase in discharge pressure raises energy consumption by roughly 1% at full output — per U.S. DOE guidance
- Any flow detected during zero-demand periods equals leakage — target below 10% of total system flow
What You Need to Measure Air Compressor Performance
Choosing the wrong instruments — or measuring under unstable conditions — will produce numbers that look plausible but are wrong. Get the tools and setup right before you take a single reading.
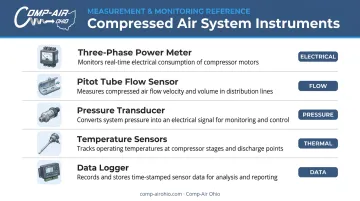
Tools and Instruments Required
| Instrument | Purpose |
|---|---|
| Three-phase power meter with current clamps | Measures true kW input across all three motor phases |
| Pitot tube flow sensor (wet-rated) | Measures actual discharge flow including moisture and particulates |
| Pressure transducer or calibrated gauge | Monitors discharge pressure at the measurement point |
| Inlet and discharge temperature sensors | Required for FAD correction calculations |
| Data logger or portable compressed air analyzer | Correlates all readings simultaneously with time stamps |
Skip the ammeter — use a true power meter. Real power in a three-phase system requires voltage, current, and power factor across all three phases:
kW = (A × V × 1.732 × PF) / 1000
Current measurements are unreliable at partial load — the DOE notes that in the low-load region, power factor changes non-linearly, making amps a poor proxy. Always measure true kW.
Use a wet-rated pitot tube at the discharge outlet. Sensors like the SUTO S431 or Omega Air OS 430 handle wet, high-temperature discharge air and measure flow, pressure, and temperature simultaneously. They support ISO 1217 reference condition corrections (20°C, 1000 mbar) and avoid the pressure drop penalties that inline flow meters introduce.
Preconditions and Setup
Before logging any data:
- Run the compressor to stable full-load operation — transient readings during loading or pressure recovery are not valid
- Stabilize system pressure at normal operating setpoint — pressure fluctuations during measurement skew both flow and power readings
- Record ambient inlet conditions — temperature, barometric pressure, and humidity must be captured to correct discharge flow back to ISO 1217 reference conditions (20°C, 1 bar absolute, 0% relative humidity)
- Measure at the discharge outlet — intake-side readings do not represent delivered FAD; ISO 1217 requires measurement at the compressor package discharge point, corrected to reference conditions
Methods to Measure Air Compressor Performance and Efficiency
Three methods cover the full range of use cases — from a one-time acceptance test to continuous degradation monitoring. All valid methods require outlet-side measurement and correlated power data.
Method 1: FAD and Specific Power Measurement (Pitot Tube + Power Meter)
This is the primary method for calculating true compressor efficiency. It measures actual compressed air output (FAD) at the discharge and correlates it with measured electrical input to derive Specific Power , typically expressed as kW/100 CFM per CAGI data sheet conventions.
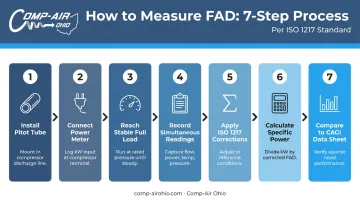
Step-by-step:
- Insert the pitot tube sensor into the discharge pipe per the manufacturer's installation guide
- Connect the three-phase power meter with clamps to all three motor phases
- Allow the compressor to reach stable full-load operation
- Record simultaneous readings of flow, power, discharge pressure, and temperature
- Apply ISO 1217 correction formulas to convert discharge flow to FAD at reference conditions (20°C, 1 bar, 0% RH)
- Calculate Specific Power: input kW ÷ delivered flow (per 100 CFM)
- Compare against the manufacturer's CAGI data sheet value
For context on what "good" looks like: Atlas Copco's published CAGI data shows the GA30 at 100 psig delivering 195 CFM at 37.2 kW, a specific power of 19.1 kW/100 CFM. The larger GA250 Hybrid achieves 15.8 kW/100 CFM at the same pressure.
Gardner Denver publishes all rotary screw FAD data measured in accordance with ISO 1217 Ed. 4, Annex C and E, giving buyers a verified baseline for direct comparison.
Best for: Acceptance testing, procurement comparisons, regulatory compliance, annual efficiency benchmarking.
Limitation: Not ideal for short sampling windows on compressors that cycle frequently between load and unload ; stabilize the system first.
Method 2: KPI-Based Continuous Monitoring
Rather than a single-point FAD test, this method tracks multiple performance indicators over time to detect gradual degradation that point-in-time audits miss.
KPIs to monitor:
- Discharge pressure (stability and setpoint deviation)
- Flow rate (trending against baseline)
- Power consumption (kW trending over time)
- Ambient and discharge temperature
- Dewpoint (rising dewpoint indicates dryer or filtration issues)
- Leakage rate (measured during zero-demand periods)
Step-by-step:
- Install permanent or semi-permanent sensors at each KPI measurement point
- Set baseline values from the initial FAD test or manufacturer CAGI data
- Configure data logging with time-stamped records for trend analysis
- Monitor for deviations — note that each 2 psi increase in discharge pressure raises energy consumption by approximately 1% (DOE FEMP)
- Detect leakage by running the compressor during non-production periods with all air-consuming equipment off — any flow detected equals leakage. DOE guidance sets 5–10% of total system flow as the cost-effective leak-reduction target; systems above 20% are considered poorly maintained
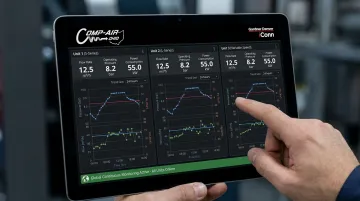
Gardner Denver's iConn remote monitoring service, available as standard on the Electra TS/TSV series and integrated on PureAir oil-free models, provides real-time KPI tracking through the GD Governor touchscreen controller. The system logs volume flow, operating hours, network pressure, and motor speed, and connects to the Air Command platform for 24/7 remote visibility, trend analysis, and early-warning diagnostics.
Best for: Predictive maintenance scheduling, catching gradual efficiency loss between annual tests, multi-compressor facilities.
Method 3: Volumetric Efficiency Calculation (Reciprocating Compressors Only)
For reciprocating piston compressors, volumetric efficiency compares actual air delivered to the theoretical swept volume of the pistons. This is a reciprocating-specific concept and does not apply to rotary screw or centrifugal compressors.
The calculation accounts for three key factors:
- Swept volume — derived from bore, stroke, and cylinder count
- Clearance volume and compression ratio — which reduce actual output below theoretical capacity
- Lubrication losses — friction and seal inefficiencies that compound mechanical wear
Comparing the result against a measured FAD from the pitot tube test quantifies real-world mechanical losses and helps diagnose internal wear in cylinders, valves, or piston rings.
Best for: Diagnosing cylinder, valve, or piston ring wear in reciprocating units — not a substitute for FAD testing.
How to Interpret Your Results
Measurement data is only useful if you act on it proportionately. Here's how to read what you're seeing.
Acceptable Performance
Per CAGI's ISO 1217 Annex C tolerance tables, acceptable volume flow tolerances range from ±4% to ±7% depending on flow rate (tighter tolerances apply to larger machines). Specific power tolerances run ±5% to ±8% across the same flow bands.
If your measured FAD and specific power fall within these bands:
- Document results as your verified baseline
- Continue scheduled monitoring and service intervals
- No corrective action required
Minor Deviations
Signs of developing issues:
- FAD measurably below nameplate but within the wider tolerance band
- Specific power slightly elevated above CAGI data sheet value
- Dewpoint trending higher than normal
- Pressure dropping marginally below setpoint during peak demand
These typically point to filter fouling, minor seal wear, or a control pressure setpoint drifting too high. Address these early with targeted steps:
- Replace air/oil filters — ZEKS elements, for example, are rated below 1 psi initial differential, with replacement triggered at 3 psi. A clogged filter quietly raises energy consumption and reduces effective FAD.
- Check pressure relief settings and control pressure setpoints
- Inspect for small leaks using ultrasonic detection
- Schedule a service inspection before issues compound
Out-of-Spec Readings
Indicators of serious performance loss:
- FAD significantly below nameplate beyond the Annex C tolerance band
- Specific power materially above the CAGI data sheet value
- Discharge temperature abnormally high
- Compressor running continuously or short-cycling to maintain pressure
- Sustained pressure drops during normal production demand
Any combination of these signals internal mechanical wear, major leakage, or component failure — take the unit offline for professional evaluation before further damage occurs.
Comp-Air Ohio provides comprehensive compressed air audits covering system evaluation, airend assessment, and efficiency upgrade analysis. As an authorized Gardner Denver distributor serving Northern Ohio since 1977, they can help diagnose and resolve performance losses at the root. Reach them at (440) 237-6700.
Common Measurement Errors
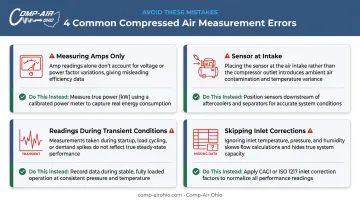
These four mistakes produce false readings that either hide real problems or trigger unnecessary maintenance:
Measuring amperage instead of true three-phase power: Without voltage and power factor, your kW calculation is unreliable. The DOE notes current is not a useful load indicator in the low-load region due to non-linear power factor behavior. Use the full formula: kW = (A × V × 1.732 × PF) / 1000
Placing the flow sensor at the intake: Intake flow is not FAD. CAGI defines FAD as delivered capacity at the discharge terminal point, corrected to reference conditions. Intake measurements skip internal losses and overstate performance.
Taking readings during transient conditions: Data captured while a compressor is loading, unloading, or recovering from a pressure event does not reflect steady-state performance. Wait for the system to stabilize at its operating setpoint before logging.
Skipping inlet condition corrections: Comparing raw discharge flow to nameplate FAD without correcting both to ISO 1217 reference conditions (20°C, 1 bar, 0% RH) creates artificial efficiency gaps or masks real ones.
Safety and Best Practices
Safety Precautions for Compressor Testing
- Never insert sensor probes or remove access points while the system is pressurized
- Follow OSHA 29 CFR 1910.147 lockout/tagout procedures for any physical access (covers pneumatic stored energy, electrical, and mechanical sources)
- Release stored pressure before any maintenance contact with pressurized components
- Wear safety glasses and hearing protection near running compressors
- Keep the measurement area clean and well-lit to avoid misreading gauges or sensor displays
Instrument Calibration Best Practices
- Verify calibration against known standards before each test campaign
- Record ambient temperature, barometric pressure, and humidity at both the start and end of each session to support accurate FAD correction calculations
- Contaminated sensor tips (oil, water, particulates) on pitot tube sensors will skew flow readings — inspect and clean before each test
Conclusion
Accurate FAD and specific power measurement is not a one-time task — it's the foundation of any structured efficiency program. Without reliable baseline data, you can't distinguish normal performance from early-stage degradation, and you can't make a defensible case for maintenance investment or equipment upgrades.
The action you take should match what the data shows:
- Within CAGI/ISO Annex C tolerances: Continue scheduled monitoring and document your baseline for trend comparison.
- Minor deviations: Inspect filters, run a leak survey, and verify pressure setpoints before the issue compounds.
- Out-of-spec readings: Schedule a professional evaluation — delays translate directly into higher energy bills and unplanned downtime.
Frequently Asked Questions
How do you calculate air compressor efficiency?
Divide input power (kW, measured with a three-phase power meter) by actual air output (FAD measured at the discharge outlet) to get Specific Power in kW/100 CFM. Compare that figure to the manufacturer's published CAGI data sheet value or ISO 1217 benchmarks — the closer your measured value to the datasheet, the better the efficiency.
How can you tell if a compressor is inefficient?
Key warning signs include FAD dropping measurably below nameplate specs beyond the ISO 1217 Annex C tolerance band, specific power rising above the CAGI data sheet value, the compressor running longer or cycling more frequently to maintain pressure, or any flow detected during zero-demand periods.
What is Free Air Delivery (FAD) and why does it matter?
FAD is the actual volume of compressed air delivered by the compressor, expressed as an equivalent volume at ISO 1217 reference conditions (20°C, 1 bar absolute, 0% relative humidity). It's the standard metric for comparing compressor output capacity and verifying that real-world performance matches the manufacturer's specifications.
What tools are needed to measure air compressor performance?
You need a three-phase power meter with current clamps, a pitot tube flow sensor rated for wet discharge air, a pressure transducer or calibrated gauge, inlet and discharge temperature sensors, and a data logger to correlate all readings simultaneously. Amperage-only clamp meters are not sufficient.
How often should air compressor efficiency be tested?
Conduct a formal FAD and specific power test at commissioning and annually thereafter, with continuous or monthly KPI monitoring (pressure, power, flow, dewpoint) in between. Run an immediate out-of-cycle test whenever pressure drops unexpectedly or energy consumption spikes without an obvious cause.
What is Specific Energy Requirement (SER)?
SER — also called Specific Power per CAGI convention — is the electrical energy consumed to deliver one unit of FAD at a given pressure, expressed as kW/100 CFM. It's the most direct measure of compressor efficiency, allowing you to compare different machines objectively or track degradation in the same unit over time.